
Jimmy the GOAT? – or the perils of aggregate totals
As James Anderson hangs up his boots, debate has swirled around as to where he fits in the pantheon of Test cricket greats. He’s a great, no doubt, but is he the GOAT of quick bowlers? England skipper Ben Stokes thinks so, based on a wicket haul of 700, the most of any Test quick.
The next best is Stuart Broad at 604, with apparent plodders like Curtly Ambrose, Wasim Akram and Richard Hadlee languishing in the 400s.
Aggregate numbers have become a favourite of cricket writers and TV commentators – lists of career wickets, runs or centuries are posted as if showing the best of all time. You’ll notice that most players on the lists are from the last thirty years or so. For the simple reason that they’ve played a hell of a lot more Tests per year since the 80s – more countries, more money, more full time cricketers. But this is seldom explained and the lists are presented as though they are a measure of quality, not quantity.
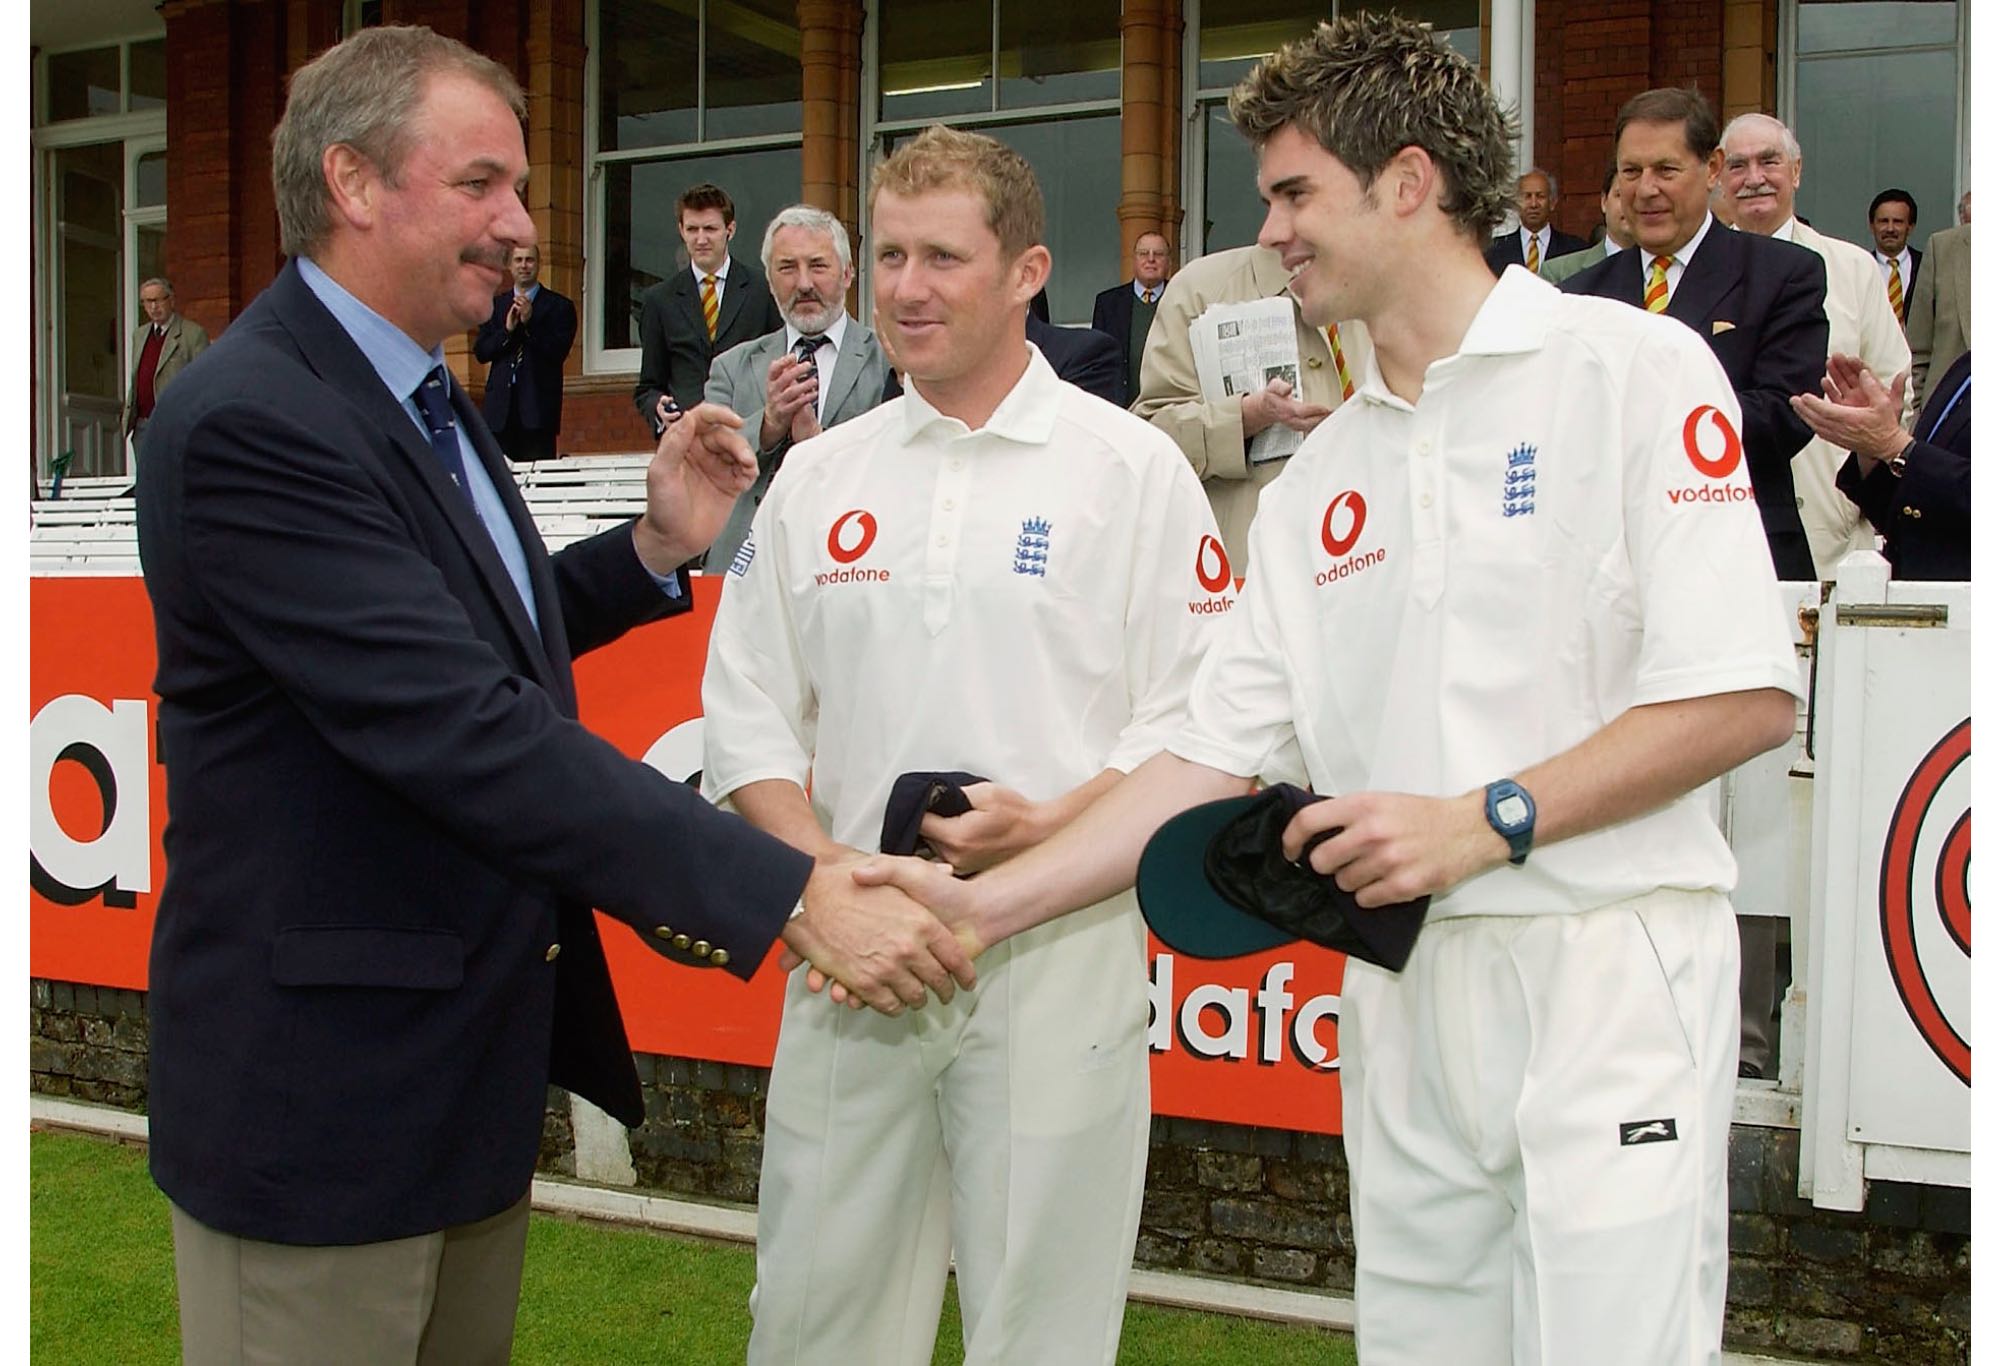
James Anderson of England receives his first cap from David Graveney, during the first day of the Test match between England and Zimbabwe at Lords Cricket Ground, on May 22, 2003 in London. (Photo by Tom Shaw/Getty Images)
If they aren’t the best measure of quality, don’t total wickets or runs at least give proper recognition for a long and successful career? No, they fail on that score too. England’s Graeme Swann managed to bag 255 wickets in only five years (2008-13) from 60 Tests, while the great Clarrie Grimmett – arguably the equal of Shane Warne – took 236 in only 37 Tests (1925-36).
Don Bradman played for two decades and scored 6,996 runs in 52 Tests. England’s top run scorer, Alastair Cook, played for only 12 years and scored 12,472 runs throughout 161 Tests. That represents only 1.8 times as many runs in 3.8 times as many innings. So it’s no surprise that Bradman’s average was more than double Cook’s. Yet Bradman is now only 55th on the list of all-time run-scorers and 13th on the list of Australians. So young or new TV viewers won’t see him on the charts.
But for bowlers, surely playing for nearly 21 years at the highest level like Anderson is something special – something unprecedented?
The pace bowler who came closest was Pakistan’s Imran Khan, who graced the Test pitch for 19 years, while Richard Hadlee, Courtney Walsh and Wasim Akram did 17 year stints.
Durability is best measured, however, not just by the years played, but even more by the amount of cricket played. For bowlers, this means how many balls they bowled in ALL forms of cricket, not just Tests. Here are the figures for Anderson, Imran, Hadlee and Wasim during the total span of their Test careers in all forms of cricket:
Bowler (Test wickets)YearsTestsAll MatchesOversTotal wicketsTest bowling averageBatting
Runs (all cricket)Imran Khan ( 362)1971-908891115,3651,99822.831,363Richard Hadlee (431)1973-908672214,4022,02022.318,285Wasim Akram (414)1985-200210488213,4241,94323.614,913James Anderson (700)2003-2418764312,3551,55326.52,532
So Imran bowled 3,010 overs more than Anderson over a slightly shorter period – around 150 more per year. Hadlee bowled 2,047 more in 17 years, about 120 more annually. Further, Imran scored nearly 30,000 more runs then Anderson: what’s that – the equivalent of another 5,000 extra overs of running and more than one thousand hours out on the ground?
Yet Anderson ends up with 300-400 more Test wickets than these champions thanks to playing 100 more Tests but much less cricket. Put another way, nearly 30% of Anderson’s matches were Tests, compared to less than 10% for Imran and 12% for Hadlee and Wasim.
The simple reason is that after English cricket introduced central contracts in the 2000s, Test players were kept in cotton wool and didn’t have to play much domestic cricket. So comparisons about durability and longevity with earlier years became meaningless. Apples and oranges. Much of the extra cricket for Imran, Hadlee and Wasim was in county cricket, playing for ten or more years, usually 25 or more matches per season.
To take another example, across Glenn McGrath’s 13-year Test career from 1993 to 2007, he bowled 1,800 more overs in all forms of cricket than Anderson did across his last 13 and a half years from the 2010 season (he bowled 7,904 overs, i.e. 1,800 fewer than McGrath). So, cotton wool.
Away and against the best
Anderson’s record doesn’t match up to the greats across another metric: results against the best teams of his era. In Anderson’s time, this would be Australia, South Africa and India.
Anderson had a good record against India, averaging 25.5 home and away, but was ordinary against South Africa (30.1) and mediocre against Australia, despite some great moments, averaging 36 across 39 matches. This is way worse than other greats. Anderson ranks a lowly 76th out of 121 in averages among all Test players who bowled 20 innings or more against Australia, worse than players such as Chris Woakes and Zaheer Khan. The full list of 121 includes all-rounders and part timers.
The worst averages against Australia for quicks sometimes described as greats are Harold Larwood on 30 and Allan Donald on 31. But other greats like Hadlee, Imran, Ambrose, Malcolm Marshall, Michael Holding, John Snow and Fred Trueman averaged 25 or under.
Another key measure is performances away from home. These present a higher degree of difficulty; are more comparable with other players; and challenge bowlers in a wide range of conditions.
Anderson averaged 31 away from home, while the very best all averaged in the low to mid 20s: McGrath 20.8, Ambrose 20.9, Marshall 21.6 and Hadlee 21.7. It’s been a bit harder to perform away from home in the last ten years or so, with shorter tours and less acclimatisation. But Jimmy is still not in the same ballpark.
Scott Kuggeleijn is dismissed by England’s James Anderson. (Photo by Phil Walter/Getty Images)
So how do you rank the greatest of all time? There are many ways to skin that cat. Often it comes down to subjective judgement. Raw career bowling averages are perhaps too rough and ready, although they arguably reflect quality better than batting averages. On raw career averages alone, Anderson ranks 39th among all pace bowlers with greater than 50 Test innings. The top four are Syd Barnes, Alan Davidson, Jasprit Bumrah and Malcolm Marshall.
My own approach would be to look at averages over an extended peak. Say, ten years, giving a weighting of 60-70% for averages away from home, while excluding performances against minnows, which today would be teams like Afghanistan, Ireland and Zimbabwe. I will leave for another day further discussion of this method and where Anderson fits into the picture (spoiler alert – it doesn’t help him).
In the meantime, vale Jimmy. Thanks for an incredible career. But please, cricket commentators, enough already with the lists of total wickets and runs. It might look nice, but making such comparisons out of context would fail Year 6 maths. It is also disrespectful to the legacy of past greats who didn’t get half the opportunities but worked as hard for a fraction of the money.